The Division of Social Services (DSS), within the Delaware Department of Health and Social Services, is directly responsible for administering Delaware’s Supplemental Nutrition Assistance Program (SNAP), previously known as the Food Stamp Program.
In February 2016, 146,252 clients in 70,728 households were receiving SNAP benefits. This represents roughly 16% of the State's population.
DSS recognized that many of the internal business processes were inefficient. These inefficiencies negatively impacted customer service, benefit delivery timeliness, and worker productivity. DSS senior management desired to streamline core business processes, eliminate nonvalue-added work, and increase individual productivity. Because DSS case workers also handle the state’s other benefit programs, including Medicaid, Temporary Assistance for Needy Families (TANF), and Child Care, the agency expected that this work would have a positive impact on all of its programs.
The Division of Social Services decided to launch a project to address these process efficiencies. The goals of this project were to:
- Increase productivity and case processing efficiency
- Streamline business processes
- Reduce errors
- Reduce process complexity
- Standardize processes statewide
The Division of Social Services selected Iknow to perform this assignment.
Iknow used three primary methodologies on this assignment.
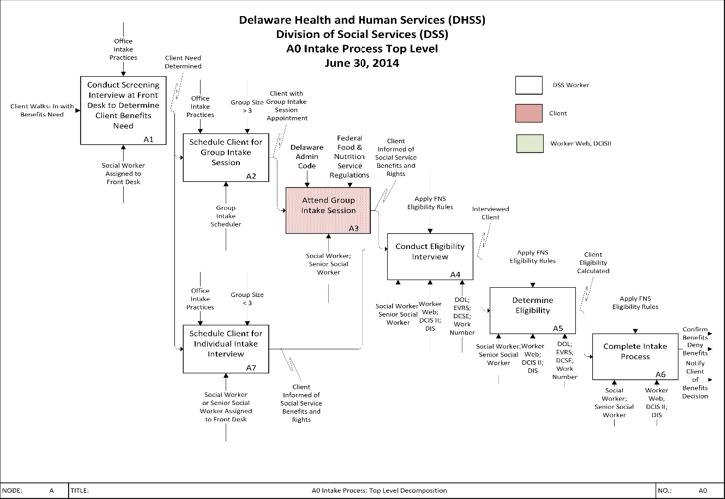
- Business Process Mapping. The objective of process mapping is to graphically illustrate the sequence of activities and tasks in a business process. We used the IDEF0 process mapping standard so that we could have a consistent way to display and interpret the processes. Iknow created more than 50 maps that covered the six core processes and one common subprocess. More than 220 individual process steps were characterized; maps with up to four levels of process decomposition were created.
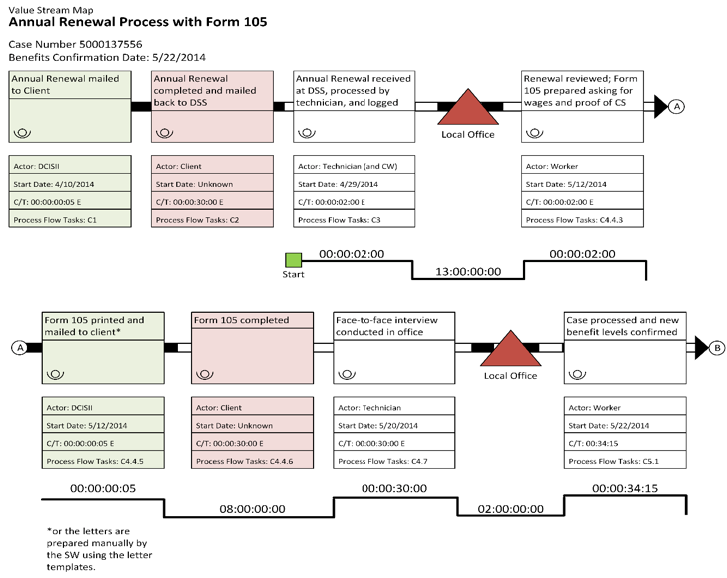
- Value Stream Mapping (VSM). The objective of value stream mapping is to graphically illustrate “where” and “how much” important process metrics change in the process. For example, if an important metric is processing time, then the value stream map would show where processing time accrues throughout the process. If the important process metric is defects, then the value stream map would show where defects are occurring throughout the process. Iknow constructed 24 VSM maps for the DSS.
- Improvement Project Portfolio Evaluation and Optimization. The objective of creating a portfolio of improvement projects is to provide a structured approach for evaluating the improvement ideas that surface throughout the project. Each project is evaluated uniformly against a common set of criteria, such as return on investment, implementation speed, likelihood of success, and level of impact on certain groups of stakeholders.
More than 60 individual and group meetings were held. Business process mapping provided the following insights:
- The core business processes varied significantly in terms of number of discrete, meaningful steps, from as few as 5 steps to as many as 58 steps. The Intake Process and the Annual Renewal Process were the most complicated processes based on the number of process steps.
- The processes were primarily performed in serial; not many process activities were performed in parallel. Additionally, the number of handoffs between DSS staff was small, indicating a minimal number of process loops.
An example of a process flow map is illustrated in the exhibit below.
Process Flow Map - Intake Process (Top Level)

Value stream mapping provided the following insights:
- Process lead times were highly variable and ranged from 4 days to 63 days across the 22 representative cases analyzed that covered the Intake, Periodic Report, and Annual Renewal processes. Process lead times ranged between 7 and 29 days.
- Process lead times were longer when the case’s supporting documentation was missing and worker follow-up was needed to complete the case. Requesting supporting documentation from a client and the additional processing tasks added roughly 14 calendar days to the overall process lead time.
- Based on an analysis of the processes, long process lead times were NOT correlated to case complexity.
- The value-added times ranged between 8 minutes and 2 hours per case processed.
An example of a Value Stream Map is illustrated in the exhibit below.
Value Stream Map - Annual Renewal Process

Iknow produced the following primary deliverables:
- Current-state business process maps and VSM analysis
- Future-state design
- Portfolio of performance improvement ideas
- Recommendations
- Process improvement plan and roadmap
The DSS immediately began implementing the improvement roadmap.


